
Connecting the dots – Social Engagement Clusters
Evan Davies | Oct 2, 2019 | 4 MIN READ
Updated: Jan 17, 2024
Identifying genuine associates of an individual can be challenging in the world of social media. There are many platforms and a lot of them don’t restrict who can follow you or who you can follow by default (e.g., Twitter and Instagram). This means that friends lists and followers/following lists do not provide an accurate picture of genuine associates.
Social engagement metrics (likes and comments on a post) can be analysed to work out clusters of individuals. Analysing as few as six photos from a Facebook user to identify who routinely likes the photos can be very useful in identifying common circles of friends. This is because:
- friends’ lists are not reflective of genuine associates.
- friends’ lists are often hidden.
- rapidly reduce person of interest (POI) lists to focus efforts.
Sometimes when analysing fake profiles, this method can reveal the true person behind the profile because they demonstrate poor tradecraft and routinely like the fake account from their real account to generate interest. It also highlights what not to do if you are using online personas!
In your collection phase, spare a thought for how data will appear in your analysis. It is very easy for a clustering illusion to occur. Clustering illusion is seeing a pattern where it doesn’t exist, which is mainly due to (1) small sample size and (2) the impact of timeframes.
For example, our task is to analyse social engagement metrics to assess the network of an individual on social media. The objective is to understand their genuine associations. Firstly, we must decide to take data from either (a) the last three years of social media interactions or (b) the last three months of social media interactions. Which one is going to be more accurate? Do we need to consider life changing events in either timeframe? Do recent interactions have more weight or less weight in our assessment? Do we conduct two separate collections, and contrast the two datasets?
In this blog, we’ll work through the concept and step through the process on Facebook. To start with, this is the high level concept.
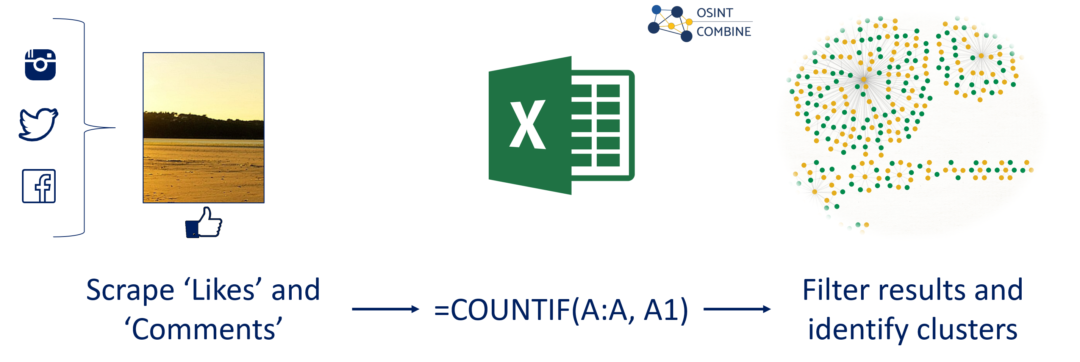
Collection
There are significant limitations when using manual techniques. Therefore, we are heavily reliant on scraping tools. Click here for our recommended scraping tool.
- Install the Chrome Extension (also works in Brave).
- Identify the photo or post.
- Click on the ‘Likes’ or ‘Comments’ button and expand all (scroll all the way to the bottom).
- Right click any name that appears and click Scrape Similar.
- Click ‘Copy to Clipboard’ when the next window opens.
- Paste into spreadsheet and repeat as necessary.
To ascertain the frequency of engagement, scraping ‘Likes’ and Comments’ may change slightly from platform to platform, however; the overarching concept remains the same. The process is repeatable on most social media platforms which collect and display user engagement metrics. However, not all social media profiles allow this type of collection to occur, or if they do, users can choose to block this through their profile security settings.
Note On Instagram: Instagram has a setting where a user can hide the number of users who engage with a photo uploaded. If turned on, the resulting information may be incorrect, impacting our assessment.
Processing
An easy and repeatable method is as follows:
Scrape the likes and comments of a post and put the results of the users’ names in a single column in a spreadsheet (Column A)
- Repeat this for as many photos/comments as possible and keep adding the names to the list to create a single long list of names which will contain a lot of duplicates.
- We leverage these duplicates to calculate how often the same user is present to identify clusters of routine/genuine associates.
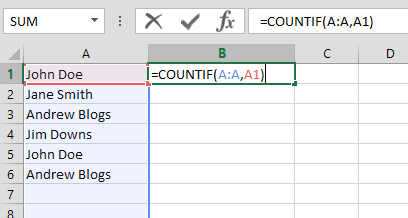
- To calculate how often the user is present we use the COUNT function. Simply put this formula in the Column B (1st Cell) and duplicate it down: =COUNTIF(A:A, A1)
You should end up with the spreadsheet looking like this:
then this:
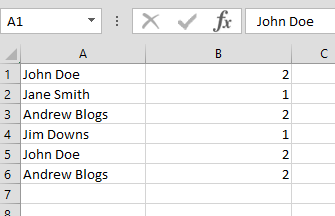
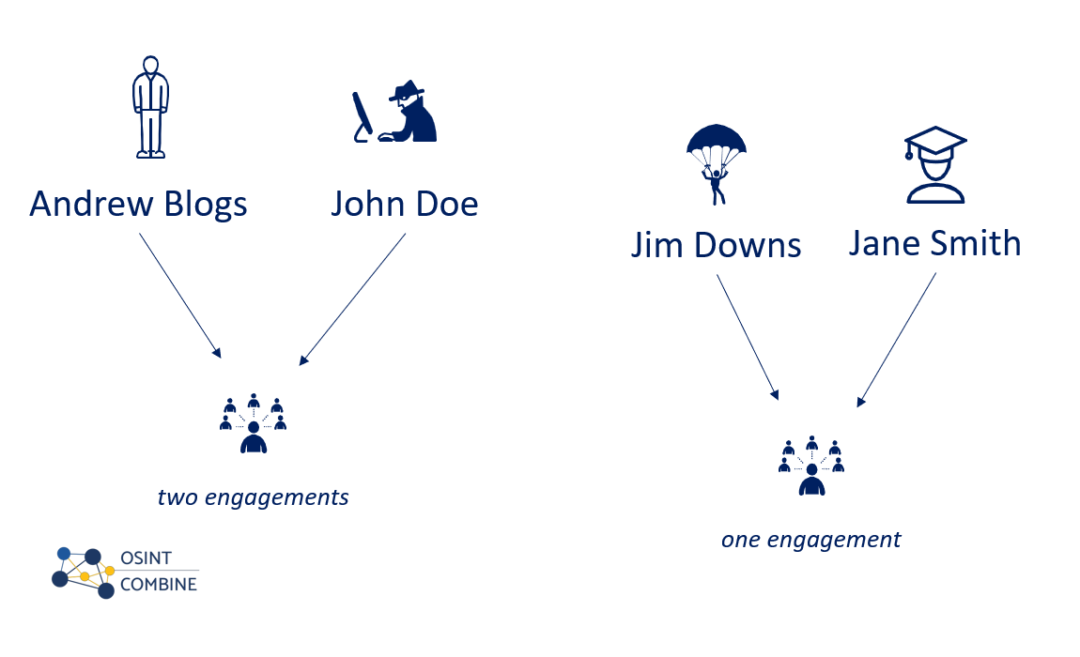
You will notice that it has calculated how often each user is present in the dataset. For example, “John Doe” and “Andrew Blogs” are present twice.
In this case, the POI has limited information on their profile, therefore, pivoting to investigate John Doe and Andrew Blogs can help us find additional information or leads.
Investigation and Analysis
There are many use-cases for this, such as a missing person case.
- Form an identified associates list to help find a person or identify other pivot points to investigate.
- Understand social networks based on engagement to identify confirmed associates they engage with.
- Additional information – find other imagery of the person on the associate profiles.
- Identify associates of the person that was not previously visible.
- Assist in reducing a geographical area, for example, the person has minimal information on social media, however; several close associates provide information of where they are located.
The key disadvantage of this method is the inability to observe the connections that are not on social media, or true connections via encrypted platforms, such as Signal.
To support OSINT collection and analytical capability uplift and to delve deeper into some of the learnings above, please look at our in-person training or our self-paced online training.
Alternatively, contact us at [email protected] to learn about our bespoke training offerings.
Note: all techniques detailed in this post are for educational purposes only and should not be used for illegal activity. OSINT Combine takes no responsibility for your use of this information.